Friday, June 30, 2023

Dave Computes Advanced Penrose Patterns

In an earlier post, I showed relationships between various Penrose tilings. In this post, I'll show my favorite ways to decorate Penrose tiles, in order to generate interesting patterns. The first is created by adding bold lines to the 5-pointed star, 3-pointed boat, and 2-pointed diamond tiles, as shown below.

Here is a resulting pattern.


My favorite thing about this pattern is that the bold lines form closed regions of ever larger sizes. The smallest regions are the 5-pointed star tiles. The next larger areas are stars formed by 5 diamond tiles. Then come "stars" formed by 5 boats, like the white ones surrounding the gray star tile near the bottom of this image. In fact, we can think of each of these closed regions as being its own tile in an infinite set of aperiodic tiles. Furthermore, we can color those regions, so that regions of one color are always completely surrounded by regions of the opposite color, as shown below. Notice that congruent regions in the same orientation are always assigned the same color.


Here are rules for drawing a similar pattern based on pentagons with 5, 3, or 2 neighbors each.


And here's a resulting pattern.


And colored to show closed regions.


Notice that each closed region consists of pentagons that are all oriented in the same direction, and all pentagons of the same orientation are assigned the same color. Pentagons require a large grid to appreciate the structure, but I love all the gear-like shapes that emerge, like in the following drawing.


I've colored the same pattern, in order to highlight the different sized regions.


Wanting to see more detailed patterns, I set out to make them using smaller tiles, starting with these house-shaped tiles.


And here's a pattern made with these smaller tiles.


Then I explored even smaller "pentagons", in which I collapsed the house pentagon (left image below) until it formed a rectangle (right image below), with one long side of the rectangle consisting of two edges of the "pentagon", and the other long side consisting of a single longer edge.
And here's a pattern that results from using rectangles in this fashion. (I don't find it especially pleasant, and it's really confusing to draw.)


So, naturally, that brings us to my craziest idea of all: using squares to represent pentagons. Specifically, treat one of the corners of each square as if it were an infintesimal fifth side. In the diagram below, consider the picture on the left. The 5 in the gray box represents a pentagon with 5 neighbors. The question marks indicate the locations of those 5 neighbors. The 5 shares an infinitesimal "side" with its upper right neighbor. The empty space above and to the left of the 5, along with the empty space below and to the right of the 5, represent spaces that will be filled with 2s or 3s that are not adjacent to the 5 pentagon. The x represents a space that will never be filled by any pentagon.


As before, there are two kinds of 5s--shaded 5s surrounded by unshaded 2s and 3s, and unshaded 5s surrounded by shaded 2s and 3s. I'm using the convention that all shaded 5s have an x in the lower left, and all unshaded 5s have an x in the upper right.

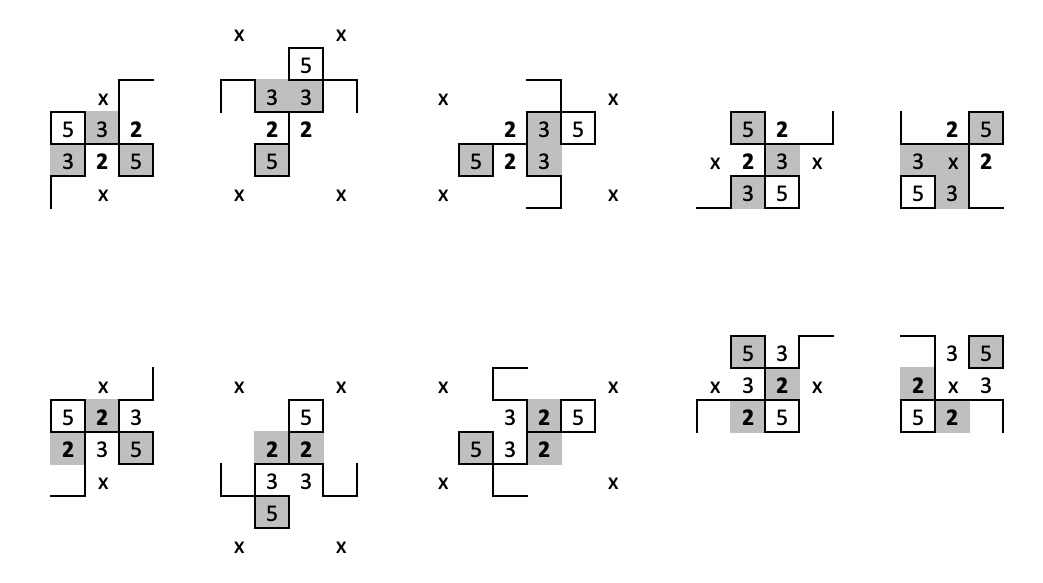
The following diagrams show all the ways that a 3 may appear adjacent to a 5.
And the following diagrams show all the ways that a pair of 2s may appear adjacent to a 5, forming a "diamond".

Here's a complete drawing using these rules. I love that these rules sometimes terminate in a square shape like this one.


Notice that the x squares (the ones that don't correspond to pentagons) form a grid, with all the x's appearing in the same rows and columns (and that the particular rows and columns correspond to bits in Fibonacci words). With difficulty, I can draw these patterns without writing any numbers (as long as I mark the non-pentagon squares). But I wrote a computer program to generate the larger patterns below.

50 × 50

100 × 100

200 × 200

500 × 500


Tuesday, June 27, 2023

Dave Computes Cohort Groups for Hybrid School during COVID-19

To permit social distancing during the COVID-19 pandemic, the school where I teach decided on a hybrid learning model. Each day, half the students in grades 6 - 12 would come to school in person and the other half would stay home and learn online. The school then changed its plan to split students into 4 groups, with only 1 group attending school at a time. Given the complexities of our schedule, I was skeptical that this could be done without very lopsided class sizes. And I was certain the school had no software or process to create these groups. I therefore wrote a program to put students into groups that would allow for balanced class sizes. I was shocked when it successfully generated fairly balanced classes. Here's the algorithm I used.

1.  I assign each student to a random group.

2.  I determine how balanced each section is. For example, suppose a particular section of some class has 18 students. If we're dividing students into 2 groups, then ideally there'd be 9 students in each group. But we'd be fairly happy to have 10 students in one group and 8 in the other. We'd be much less happy with an 11-7 split, and quite disappointed with a 12-6 split.

I want to pick a numerical score that captures how lopsided the split is. One way is to look at how much each group deviates from the ideal size. A 9-9 split would have a score of 0. A 10-8 split would have a score of 1, since 10 is one more than ideal and 8 is one less than ideal. An 11-7 split would have a score of 2, and 12-6 would have a score of 3. Technically, this number is called the standard deviation.

The problem with this approach is that, while 10-8 is only slightly worse than 9-9, intuitively 12-6 feels MUCH worse than 11-7. I therefore used the square of the deviation as my lopsidedness score. Thus, 11-7 has a score of 2 × 2 = 4, while 12-6 has a score of 3 × 3 = 9, as shown below.

Grp1  Grp2  StDev  Score
 9      9    0     0 × 0 = 0
10      8    1     1 × 1 = 1
11      7    2     2 × 2 = 4
12      6    3     3 × 3 = 9

(Technically, my lopsidedness score is called the variance, and it can be calculated for any number of groups--not just 2. For example, if students are split into 3 groups, then the ideal group size for a section of 18 students is 18 / 3 = 6 (technically called the arithmetic mean). If the students in this section are split 8-7-3, then the variance is [(8 - 6)² + (7 - 6)² + (3 - 6)²] / 3 ≈ 4.67.)

3.  I calculate the lopsidedness score for every section in the schedule. I add up all of those scores. That sum tells me how lopsided the entire schedule is.

4.  I pick a random student and I assign them to a different random group. Then I calculate the lopsidedness score for the entire schedule again. If the new score is higher than the old one, then the schedule is less balanced than before. I would therefore return the student to their original group. If, however, the new score is better (lower) than the old one, then the schedule is more balanced and I keep the student in the new group.

5. I continue assigning random students to random groups that reduce the lopsidedness score. Eventually, I reach a point where any change would make the score worse. I have therefore reached a local minimum, and I save these results.

6. I repeat this entire process again, assigning all students to random groups and then randomly assigning individual students to different groups until I can't improve the score anymore. Sometimes the final lopsidedness score is better and sometimes it's worse. Whenever I arrive at a new record (lower than all previous records), I save the results.

Though not optimal, the results were quite satisfactory. (Note that finding the optimal schedule for n students is an NP-Complete problem, and is therefore intractable for the number of students involved here.)

A couple of additional considerations. I kept all students with the same last name in the same cohort. That way, students in the same household would have school on the same day. I also modified the code to swap random students, in addition to swapping which cohort a single student was assigned to.